

(Read disclaimer below.)
Hello Everybody,
I hope and pray that all of you and yours are surviving this troubling time. Hang in there, this will pass.
I started writing this on March 24th, 2020 and lament that I didn’t get this out sooner; some things have gotten in the way. As I finally complete this, at the time of this writing, the DOW is down 477 points at approximately 23,177, roughly 7K off the highs, and pleasantly, about 5K off the lows.
I say the likelihood of a bottom in the markets via the S&P, DOW and the NASDAQ have been put in place. The bottom in place appears to be in the form of the recently talked about “V” formation. But I don’t think we have the particular type of “V” formation as being discussed.
Regardless of this, I believe the market bottom is in, as demonstrated below with charts and descriptions.
Why am I writing this?
Like you, I too am concerned. I’ve been in the trading scene since, well, for a long time. I still trade today and started in earnest looking for an end to this blood bath.
At one time I worked on the floor of the Chicago Mercantile Exchange (CME). The CME was one of the mega centers for futures trading. S&P, Pork Bellies, Orange Juice (think Trading Places), Cattle, Currencies, Treasury Notes and other great commodities futures were traded there. Trading has since moved online.
Before I went to the CME floor, I earned my series 3 commodities broker’s license solely for the education of it. That way I’d have a better understanding of how trading operates. Then, once at the CME, I earned further certifications directly from the CME in:
- Technical Analysis
- Advanced Technical Analysis
- Currency Trading, and
- Options Trading
Trading Wizards
I’ve had the great fortune of working side by side with some super heavyweights in the trading arena, each of them giants of the trading world. They are also subjects of a very famous trading book out there, the inaugural in the series and highly original “Market Wizards.” In ensuing years, I was the chief technical analyst for 3 hedge funds and the head trader for one of them.
Technical Analysis – One way the market’s speaks to us
Technical analysis is one of the clearest ways that the markets speak to us. It is considered both art and science and requires interpretation. Once this tool is mastered, it is at the same time both an objective and a subjective skill set, always subject to the analyzer’s interpretation.
What technical analysis attempts to do is look at past chart patterns where, over some time, past patterns acted out or traded in a particular way. These chart patterns eventually have outcomes, e.g., the markets went up, down, or sideways. In short, it’s the old saying that history repeats itself.
Using technical analysis is akin to looking at past human behavior but reflected in a chart’s price action. Based on how past chart patterns eventually acted out, we can, with some confidence, look to current chart patterns that are similar to those past ones and make reasonably educated predictions on what direction the markets will go, up, down, or sideways.
The basic notion is that people don’t change. If that’s so, then one can count on current technical chart patterns to behave as past patterns have behaved. After all, never forget that the market is made of people, not esoteric trading bars. Those trading bars are people! All technicians are doing is reading people’s behavior via the stock market’s behavior. The stock market is simply an analog for human behavior.
With that view in mind, the equities markets have historically and classically offered clues to when bad news is ending and has signaled ends of major market downturns and market bottoms.
Is the end in sight? Is it already here? Is more Hell coming to town?
In the email subject line I asked, “Is this the beginning of the end?” What I’m asking is, are the equities markets delivering a message that the worst is over, that we’re finally at the beginning of the end of this health and economic pandemic? No one knows for sure, but I’m taking a position on it.
On March 23rd, and confirmed on March 24th, an “it may be over now” message was sent by the markets. Is this a guarantee? No. But technical analysis offers tempting clues as to what may be unfolding.
Let’s cover the so-called “V” bottom.
V bottoms
The oft called “V” bottom is a bullish technical chart formation that takes the appearance of the letter V. And indeed, “V” patterns appear to have taken place on all major indices, potentially confirming a bottom. But this is not necessarily the “V” bottom Trump is talking about.
Take as fact that markets fall much faster than they recover. There are several reasons for this, but chief among them is fear. Where there’s fear in the markets, the race to the bottom is on. In the minds of the fearful, the downward spiral is a sprint event.
For illustrative purposes, here is a chart showing a “V” bottom. In this chart, note points A, B and C. Point A is the start of the left side of a “V” pattern; B is the bottom of the “V,” and “C” completes the right side of the “V” pattern. In this case, it took 3 times longer to recover than to fall; 4 days down, 12 days back to point A, and eventually higher. This is a bullish “V” pattern.
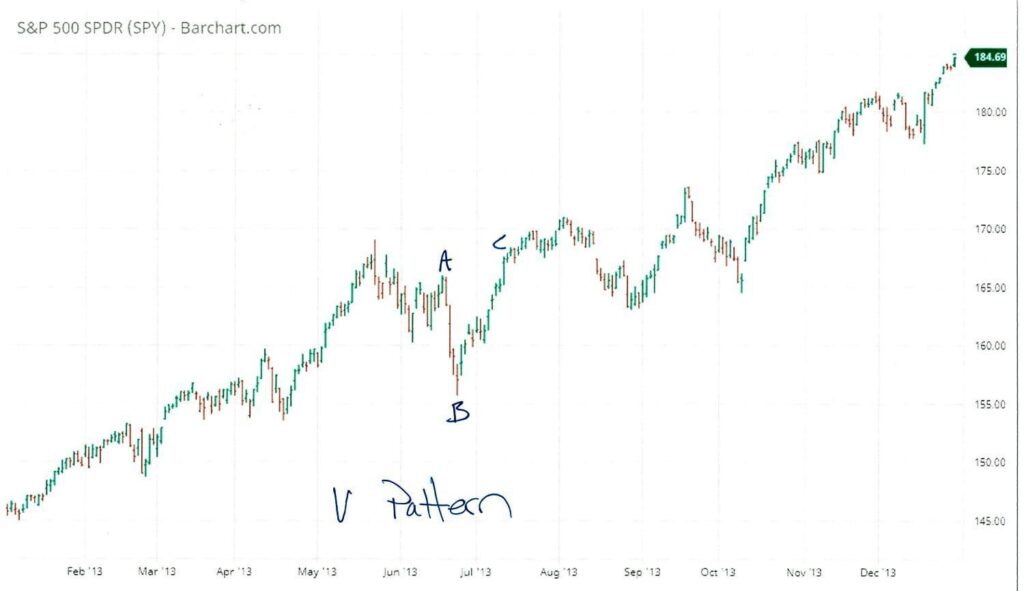
What makes this pattern a superior bullish pattern is it can offer a relatively speedy recovery – when things are normal.
Validating the “V” pattern
Only when the C side of the pattern is proximate in price to point A – and higher – will this particular type of pattern be validated, signalling a rally. In this case, you can see that the markets continued to run past point C fully validating the strength of a “V” pattern.
We do appear to be forming a “V” in the current market. But I do not believe, for several reasons, that we’ll race back to the top with a “fast V” (which is what Trump is hoping for), for these reasons:
1) We’ve fallen too far to simply race back to the top with speed. It’s a long climb under the best of circumstances back to the top.
2) The economy needs to be soundly in place for any sustained rally back to the top. That will take some time.
3) Because we’ll likely move slowly back to growth, the right side of the “V” pattern will move temperamentally, with some uncomfortable corrections. But I believe ultimately we’ll move inexorably back to normal.
4) And, it may be another technical pattern, a “U” or rounded bottom pattern that later follows a “V” pattern that may take us back to the top. But it does look like a version of the “V” pattern is at least getting us liftoff.
These 4 points above rely on 2 critical caveats I’ll mention later and without which, none of this will occur.
Potential market bottom?
Take a look at this June Dow Futures chart.
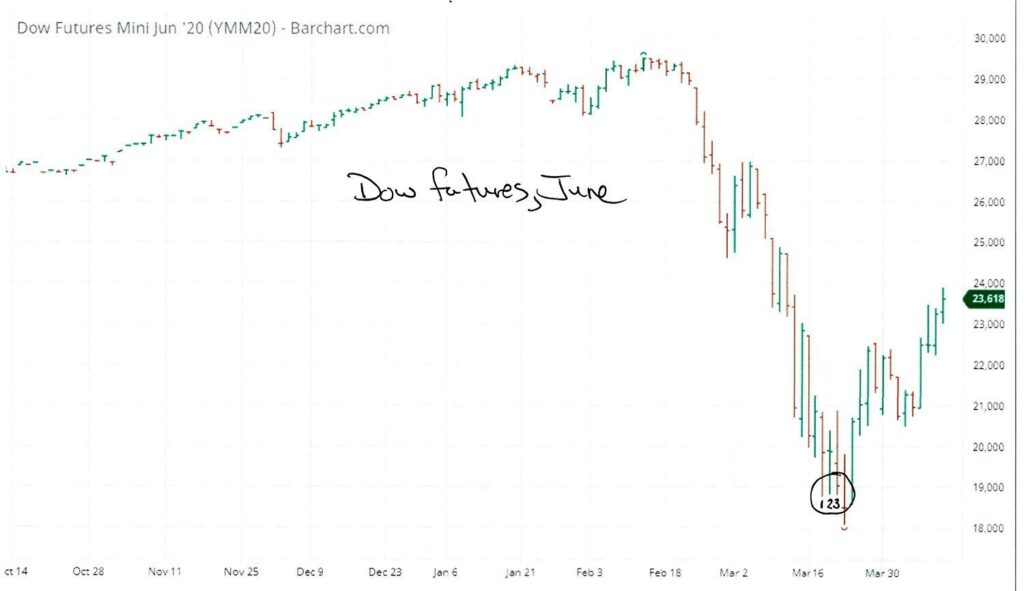 What we see here are 3 days, points 1, 2 & 3 on the chart, of a type of bottoming behavior. These are 3 heavy trading days with each day’s bottom proximate to one another. The fact that the lows of March 18th, 2020 could not be penetrated by the trading days on March 19th and 20th, is an indicator of the strength of the March 18th low. But…..
The Shake out
On March 23rd, I got a phone call from a naturally frightened 401K/IRA investor asking where the “F” (as opposed to a “V”) the bottom was going to be. I’d been watching the previous 3 days, but was not watching the day’s action on March 23rd. I was well aware of the 3 daily lows prior to the 23rd that had been put in place that looked to me like a promising technical bottom.
On this call, I explained that it was possible that the bottom was in place because:
1) We had those 3 lows at the same price levels. This is potentially technical strength, not weakness and indeed the markets have rallied off those lows.
2) We’ve had such a horrendous, hard and extended fast crash that’s just plain blown the paint of the car. Thus, I believe we’re thoroughly exhausted on the downside.
3) And I believed at that time (still do) that this complete markets washout included a necessary correction, but also added, a) a recessionary-like correction and, b) depression-like market behavior – all this in one crushing swoop.
All bad news contained in one Master tsunami. At this time, it’s like the wrestler has been taken to the mat after rounds and rounds of taking a beating, and there’s just nowhere lower to go. We’re finally on the mat. Following this brutal beating, we’ll slowly begin standing again.
But, on this call, I added one caveat so if it happened, his pain might be cushioned a bit: I explained that there was possibly – possibly – one more day of pain in store before a bottom was potentially put in. This type of trading day is called a “shakeout.”
What’s a “shakeout?”
In this case, a shakeout is the final move in market behavior when the last hands are finally “shaken out.” These last holdouts are finally giving up the ghost, finally selling off their remaining positions as they exhaustively race one another to the sidelines thus causing one more big and painful day of selling. This is what appeared to happen on March 23rd.
When shakeouts occur it’s usually the last gasp before markets start moving up again. It looks exactly like the chart does here, e.g., a hard punch through the lows, in this case, the previous 3 day’s lows, and then the markets close off the lows for the day.
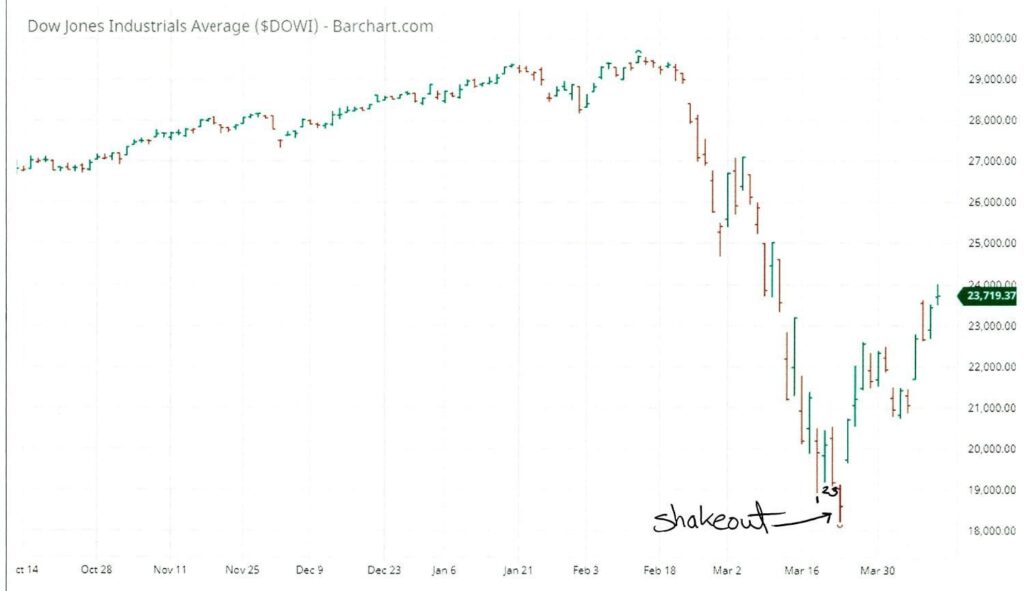
The implications were made clear on the next trading day, March 24th, 2020, when a massive rally took off, held very strong through the day, and did indeed close on the highs of that day. Given the previous 4 days this too can be called technical strength suggesting the possibility that a bottom may indeed be in, indicating a possibility of recovery.
The markets rallied for 2 more strong days, corrected a bit, then gave us another technically bullish pattern called a continuation triangle, another technical pattern that suggests more upward momentum, which in this case happened. More potential technical strength here.
The “Bernie Rally”
On April 6th, 2020, a US senator and “Social Democrat” Bernie Sanders announced that he was leaving the presidential race. How did the markets react to that? Take a look here:
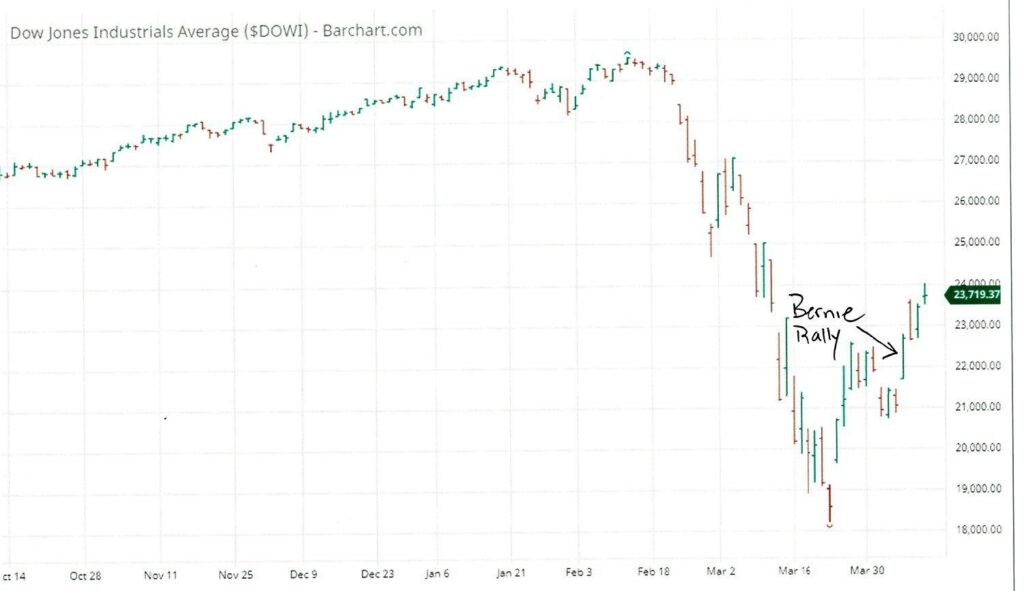
Markets love certainty, or the closest thing to it. Whether you like or dislike Bernie is irrelevant, it’s the market that rendered its opinion here.
The markets are made of conservatives, socialists, communists, liberals, democrats, progressives, libertarians – all types. On this day they collectively spoke via the markets of their negative view of Sanders’ economic policies by rallying against him.
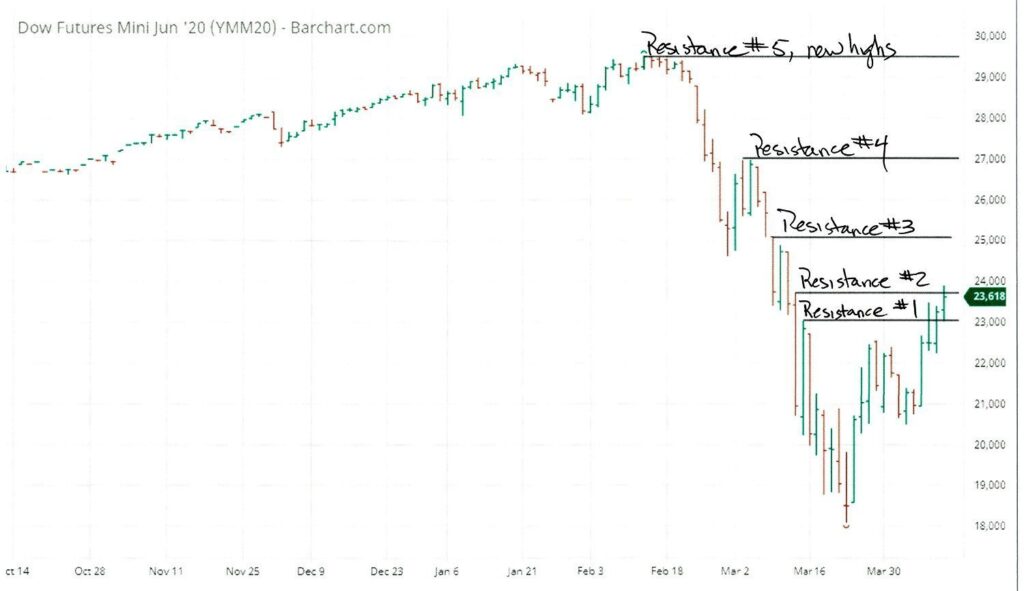
Closing in – Support and Resistance
More positive news, technically speaking: the markets have punched through important technical areas on the charts suggesting once again that the bottom may be in.
However, there’s a mountain to climb. In the next chart, there are a total of 5 “resistance levels” to penetrate. I won’t go into the details of support and resistance, but the bottom line is they are technical chart levels that prices must penetrate – resistance in this case – in order to have the potential of moving higher. On this chart, 2 of the 5 have been penetrated, but only the first resistance level convincingly:
Three Critical caveats
First, whatever you or I may feel or believe regarding Trump, love him or hate him, the markets firmly agree with his economic policies. You may not, but overwhelming and across the board, the markets do. With the markets as arbiter – not you and I – they are saying to get the economy back on order, we need both his economic policies firmly in place, and the pandemic to end.
Objectively speaking, this is what the markets are saying. Liking Trump as a person – or not – are both irrelevant to economic recovery. It’s his policies, not his personality, that has given us this unprecedented economic run.
Second, regarding the charts, if the 3 lows and the Shakeout lows are penetrated, that is, newer lows are put in below those lows, all bets are off. We could see more selloffs and a longer road to recovery.
Third, even with the “end” of COVID-19, there is likely not enough time in 2020 to get economically fully afoot. This means that, in order to fully recover and continue the bull run, Trump and his current policies must be reelected (to the pain of a great many). Biden cannot do this because his policies are much more aligned with Sanders (see Sanders Rally chart), just presented slightly differently.
Closing out
For the current probable bull conditions to continue, we need the DOW to trade, and hold, above the 24,000 level and of course continue up to the highs at 29K+. Trading below the shakeout is bad news.
While there are other ways to analyze the markets possible direction, technical analysis is how one method works. Since a crystal ball does not exist, it is the next best forecaster, a superior tool in experienced hands.
I’ve done the best I can do here for you without getting too technical. I hope I’ve shed some light for you on the current situation as I see it.
Hang in there. We’re close.

Craig
DISCLAIMER: This article is for entertainment and educational purposes only. It is not intended to suggest one way or the other for you to invest, trade, or buy or sell stocks, commodities, or how manage retirement accounts; or otherwise engage at all in the financial markets. Futures, stocks and options trading involves substantial risk of loss and is not suitable for every investor and likely not suitable for you. You should not engage in trading unless you fully understand the nature of the transactions you are entering into and the extent of your exposure to loss.